

Debugging a DirectX memory leak
A short tale (with pictures and code) of a recent debugging session.
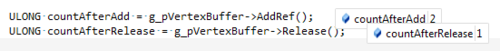
DirectX uses reference counting to handle the destruction of its resources. When creating a resource, the handle returned by DirectX already has a reference counter of 1. When this resource is not needed anymore, you call Release, each call decrements the reference counter by 1. However, the memory allocated by DirectX for this resource will only be released when the reference counter reaches 0.
Knowing this, it becomes easy to create your own objects to manage DirectX resources like a VertexBuffer.
|
|
This is quite simple in most cases, but you’ll have to read through the documentation to know which functions add or hold a reference or not.
For example looking at ID3D11DeviceContext::IASetVertexBuffers, it says “The method will hold a reference to the interfaces passed in”. That means while the vertex buffer is bound onto the device, the reference counter for this vertex buffer will be at least one. In other words, this method will call AddRef when a new vertex buffer is bound and Release on the previous one (if there was one). You usually don’t have to worry about methods like this one because they behave as expected, a quick MSDN search can find them all.
Now looking at ID3D11DeviceContext::IAGetVertexBuffers you will notice the documentation says “Any returned interfaces will have their reference count incremented by one”. This is a clue ! Again, a search can help you find these ones. However, these methods, because they query the current state of the device, should not be used too often. The calls to set the vertex buffers should be cached locally with your own device context wrapper so you don’t have to ask the driver what the current state is. These “Get” methods are expensive, and it’s easy to mess up with the reference counting.
Now onto the memory leak problem. Sometimes you have some complex rendering code, and don’t know where the references to your resources are being held. It helps to print the return value of AddRef and Release (which is the reference counter) but it would be great to know when the reference counter is incremented or decremented outside of your own code.
The first intuition that came to me is to check the memory around the pointer to the vertex buffer and check what changes around the calls to AddRef/Release. This somehow works but is not robust enough, you can get an offset and dereference the memory but depending on some parameters (that I didn’t have the time to figure out) it wasn’t the same offset every time and for every vertex buffer.
The best solution is to check what the assembler code does. Looking at the assembler code and the different calls and jumps you can figure out how to get to the right value.
After breaking into dummy calls to AddRef/Release, right click on the code and select “Go To Disassembly” (that’s in Visual Studio 2010).
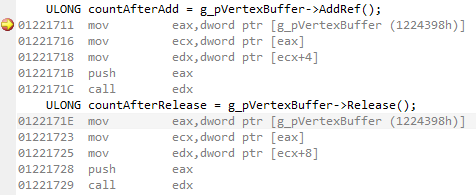
Next, you need to do step-by-step of each instruction and check the registers. Here is a rundown of the flattened sequence to the final increment of the reference counter. Activating the register window in the Debug>Windows>Registers menu is very helpful. This is disassembly from a x64 version of the code above as it’s easier to follow than x86 in my opinion, but the same steps can be applied.
|
|
At the end of the first “call” instruction, rcx contains the this pointer. Then the address in “rcx + 0x18” is dereferenced and put back into rcx. After the “jmp” instruction, the xadd instruction adds one to the value at address “rcx + 8”.
Let’s construct a helper macro to get the current reference count of our vertex buffer. This is mostly for debug purposes as the reference counter is very likely atomic (as noted by the “lock xadd” instruction which is an atomic exchange and add).
In C and C++, to be able to add bytes to an existing pointer, you need it to be char*. Doing pointer arithmetic with void* is a compile error and adding to other types shifts by the size of the type so you have to be careful. For example pInt+1 if pInt is int* will actually point to pInt+8 if sizeof(int) is 8.
|
|
Modifying the previous code to debug the reference counter gives us the right value.
|
|
Printing the address of the reference counter is very useful for setting a data breakpoint.
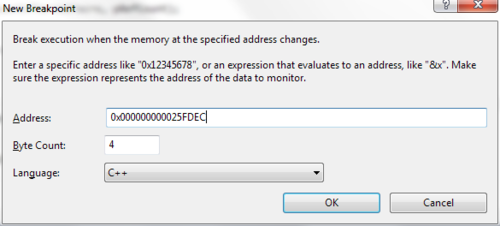
Next time the reference counter is changed internally by a DirectX call, you’ll see that the breakpoint is hit.
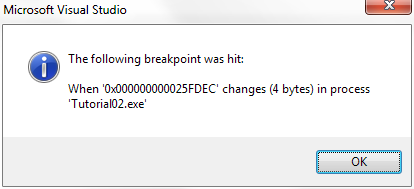
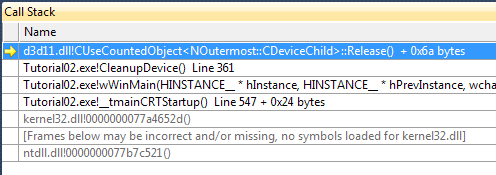
And you can see the callstack, in Tutorial02 from the DirectX samples, I hit the breakpoint during CleanupDevice which calls Release.
I hope this will help in debugging a few memory leaks which may result from some misplaced or missing AddRef/Release calls.